- Chart size, in pixels. In the form WIDTHxHEIGHT.
Maximum size is 2400x1200 by default.
Default size is 120x120 by default.
- chco:
-
Chart colours. This is a string of comma-delimited colours.
These may be HTML-style hex colours (e.g. 'FFFF00'),
named colour entities
(e.g. 'yellow'), or a mix of both. When using hex colours, do not include the hash or pound sign (i.e. use '00FFAA' instead of '#00FFAA').
Example: chco=220099,7733DD,violet,purple,indigo
If no colours are provided, the following default colours will be assigned, in this order (read from left to right, top down):
![[red, green, blue, purple, orange, brown, cyan, magenta, tan, yellow, lightblue, lightgreen, pink, silver, gold, indigo]](images/colourslist.gif)
- outputtype:
-
Output type. Acceptable values are:
- png: Output a PNG image. This is the default.
- svg: Output a SVG (Scalable Vector Graphics) file. Note that SVG support presently lags somewhat behind PNG support.
Example output: PNG vs. SVG
PNG, 125x125 pixels SVG, nominally 125x125
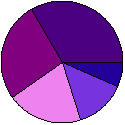
(scalable) - Small pie chart, five slices, user-specified colours, PNG output:
-
kupochart.php?cht=p&chd=t:1,2,3,4,5&chco=220099,7733DD,violet,purple,indigo&chs=125x125
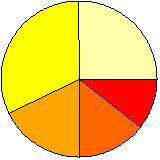
- Medium-sized pie chart, eight slices, default colours, SVG output:
-
kupochart.php?cht=p&chd=t:1.3,2.8,9.2,7.3,5,4.1,5.7,6.9&outputmode=svg&chs=400x400
Example: chs=200x200
Examples
The following are several real examples of pie chart output using KupoChart.